Ethical considerations
This study conforms to the Declaration of Helsinki, Good Clinical Practice guidelines. Some centers required and obtained approval by Ethics Committees/Institutional Review Boards. Some other centers required and obtained a waiver from approval. In most centers, however, no ethical approval or the provision of a waiver was required according to their (national) regulations, since this study used anonymized patient data retrieved in the context of clinical care. Informed consent was obtained from the parents or legal representatives of all enrolled patients, unless the relevant institutional review board or local regulators had authorised the use of anonymised patient data without additional consent14,15,17. Data on Triac effects were obtained from previous studies15,17.
Ethics Committees/Institutional Review Boards that provided approval are the Institutional Review Boards of Louisville, USA; MultiCare IRB, Tacoma, USA; Oregon Health & Sciences University, Portland, USA; Ethics Committees from Children’s Health Queensland Human Research Ethics Committee, South Brisbane Queensland, Australia; the Bioethics Committee for Scientific Research Medical University of Gdansk, Poland; the University Children’s Hospital Zurich, Switzerland; Hunter New England Human Research Ethics Committee, Australia; Comitato Etico Milano Area 1 (2018/ST/117), Milan, Italy; and in the context of a previous clinical trial the Ethics Committees from Erasmus Medical Center, The Netherlands; Panorama Medical Centre, Republic of South-Africa; Fakultní nemocnice v Motole, CZ Czech Republic; Alexandy Obregia Clinical Psychiatric Hospital, Romania; AZ Sint-Jan; UZ Brussel, Belgium; Necker University Hospital Paris, France; Toulouse University Hospital, France; Charite-Universitätsmedizin Berlin, Germany; U.O. Neuropsichiatria Infantile – Instituto Neurologica Carlo Besta, Italia; Ospedale Pediatrico Bambino Gesù, Italia; Addenbrooke’s Hospital, Cambridge, United Kingdom.
Ethics Committees/Institutional Review Boards that provided a waiver from approval or consent are the Institutional Review Board of Children’s Hospital of Philadelphia, USA (IRB #17-014224) the Ethics Committees at Erasmus Medical Center, The Netherlands (MEC-2015-362); SRCC Children’s Hospital, India; St. John’s Medical College, Bengaluru, India.
In all other centers, this was not required.
International consortium on MCT8 deficiency
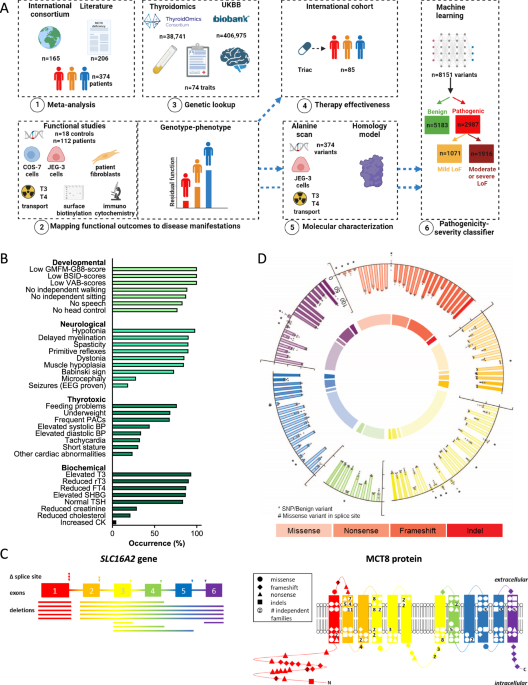
This international study was initiated on 14 October 2014 by establishing a consortium of centres where patients with MCT8 deficiency were managed14. The key inclusion criterion was genetically confirmed MCT8 deficiency. Additionally, data for first-degree and second-degree male relatives with clinical MCT8 deficiency (when genetic testing was not available at that time) were included. There were no exclusion criteria. Our cohort consisted of patients who had been enrolled in the Triac Trial I15, patients who participated in the named patient program for Triac treatment17, and historical cases for whom the Erasmus University Medical Center (Erasmus MC; Rotterdam, Netherlands) fulfilled a consultancy role following the first reports of MCT8 deficiency in 200411,12. The group of historical cases therefore contained patients who were alive and patients who were already deceased at time of enrolment. A subgroup of participants has been reported before with available individual case descriptions (n = 48), or on an aggregated level (n = 107). For these patients, updated and exhaustive data were collected.
Study objectives
Our first objective was to analyse the relation between variants in SLC16A2 and disease severity. To this purpose we determined the functional impact of variants identified in MCT8 patients using well-established cell-based disease models and assessed their relationship to overall survival (primary outcome) as well as 32 other core clinical and biochemical disease features (secondary outcomes; defined below). Further, we evaluated the association of common genetic variation in the SLC16A2 locus in healthy individuals with serum thyroid function tests and various functional and imaging brain outcomes.
The second objective was to determine the effects of Triac on peripheral phenotypic features differed among patients with different LoF classifications.
The third objective was to identify critical residues in the MCT8 protein and delineate pathogenic mechanisms of variants identified in patients with MCT8 deficiency.
The fourth objective was to establish a dual pathogenicity-severity classifier that allows accurate prediction of functional impact of any missense variant in the MCT8 protein.
Study procedures and outcomes
An overview of clinical study assessments and investigations is provided in Supplementary Tables 1–3. Clinical and biochemical features were acquired in patients who did not receive potential disease-modifying interventions such as treatment with thyroid hormone analogues. The acquisition and documentation of disease features in our international consortium has been described in detail before14,15. These data were captured according to standard operating procedures at the baseline visit for the Triac Trial [NCT0206047415] or in named-patient Triac treatment programs17, and did not receive any potential disease-modifying treatments (e.g. (anti-)thyroid drugs or thyroid hormone analogues) at time of evaluation. To reduce selection bias and taking advantage of previously reported data of additional patients, we extended this real-time cohort by adding data from previously documented cases captured from a systematic literature review (see below and Supplementary Fig. 1). These meta-analysed data on disease outcomes were used in the correlation analyses with the functional impact of variants at MCT8 protein level.
For all cases included, we aimed to retrieve demographic characteristics and genetic, clinical, neurodevelopmental, neuroimaging and biochemical features (see Supplementary Tables 2, 3), as well as data on survival, defined as age at date last known alive. The following characteristics were used in the genotype-phenotype analyses. The following data relating to neurocognitive parameters were collected: neurological clinical examination (i.e. presence of hypotonia, primitive reflexes, muscle hypoplasia, dystonia, spasticity, plantar extension response, microcephaly), MRI data (i.e. delayed myelination), functional data (i.e. EEG-proven seizures). Neurodevelopmental outcome measures included the acquisition of developmental milestones (i.e. head control, speech, independent sitting, independent walking), and scores on well-defined developmental assessments (i.e. Gross Motor Function Measure [GMFM]-8832, Vineland Adaptive Behavior scales [VABs]-II33 and Bayley Scales of Infant Development [BSID]-III34). For genotype-phenotype correlation analyses on developmental outcomes, patients who were not anticipated to have reached the outcomes at the age of assessment (based on development of healthy individuals) were excluded. The following data relating to metabolic and thyrotoxic features of MCT8 deficiency were collected: the presence of underweight (weight-for-age z-score <-2SD; overall, and specifically in early childhood, defined as 1–3 years of age), short stature (height-for-age z-score <−2SD), feeding problems (parent-reported outcome), tube feeding, gastro-oesophageal reflux disease, and elevated systolic or diastolic blood pressure; as well as results of 24 h cardiac telemetry and resting electrocardiogram (i.e. heart rate, presence of tachycardia, cardiac arrhythmia’s, conduction abnormalities, or prolonged QTc-interval). When appropriate, Z scores were calculated to enable comparison to normal development. Body weight-for-age Z scores were calculated using TNO growth calculator and heart rate-for-age Z scores were calculated using the Boston Z score calculator as used previously14,17. Weight-for-age and height-for-age Z scores were compared to the available natural history data obtained in our MCT8 deficiency cohort (Triac-naive state)14. The difference to the natural history curve was determined for each subject and used for comparison, as described before17. Given the scarcity of natural history data in subjects aged above 20 years (upper limit of the applied Z score calculators), subjects older than 20 years were set at 20 years of age. Elevated systolic and diastolic blood pressure were defined using the guidelines from the American Academy of Pediatrics35 and the American College of Cardiology and American Heart Association36. Tachycardia was defined as a resting heart rate above the 90th percentile for the corresponding age, with cut-offs as previously described37. Biochemical analyses included endocrine parameters (i.e. T3, FT4, rT3, and TSH) and serum markers that reflect thyroid hormone action in peripheral organs (i.e. SHBG, creatinine, CK, and total cholesterol). For patients enrolled in the Triac Trial, the Triac named patient program, or for whom Erasmus MC fulfilled a consultancy role, all biochemical analyses, including thyroid function tests, had been undertaken in a central laboratory (Erasmus MC, Rotterdam, The Netherlands), to minimize the effects of inter-assay variation, which is particularly present among the various antibody-based methods being used for measuring thyroid hormones. When evaluating the effect of Triac treatment on serum T3 concentrations, we used a previously documented algorithm to correct for interference of Triac in the T3 assay15.
Data from patients followed up between January 2003 and December 2020 were retrieved from October 2014 to January 2021. To minimize the confounding effect of missing data in medical records of each patient, the presence or absence of a specific parameter was only documented when it was specifically recorded as being absent or present in the medical file.
Procedures in systematic literature review
Search strategy
A computerized search of public databases Embase, PubMed, Google Scholar, and Scopus from January 2004 to August 2020 was conducted. The search terms were as follows: MCT8, SLC16A2, AHDS, Allan-Herndon-Dudley syndrome, and MCT8 deficiency. Full-text articles of abstracts were then selected, retrieved, and assessed for eligibility considering the established criteria detailed above. Inclusion was based on final consensus between at least two authors. The reference lists of all articles selected for review, and the full texts of the potentially relevant studies were also examined.
Inclusion criteria
Studies were included if they: 1) reported the SLC16A2 variant at either cDNA or protein level, 2) contained clinical descriptions of original cases, and 3) were peer-reviewed or published as an abstract in a conference paper.
Data extraction
All relevant data were extracted from selected articles or abstracts and imported into a central database. Data were cleaned and cross-checked to ensure that no individual was recorded more than once. The following information was used to identify potential duplicates: mutation (cDNA or protein change), age at assessment (in combination with publication date), inheritance information, as well as the author list. Once a potential duplicate was identified, the most recent information for that individual was included in the review and all previously reported information was integrated and cross-checked.
The study procedures of a clinical trial and a real-world retrospective cohort study, which both documented the efficacy of Triac in patients with MCT8 deficiency, were described before15,17. Briefly, through combination of the studies, we utilized data from Triac-treated patients with MCT8 deficiency with available data (n = 85; without splice site mutations: n = 80) in 33 sites. For the current study, we analyzed the changes in serum T3, TSH and fT4 concentrations, bodyweight-for-age, heart rate and serum sex hormone binding globulin (SHBG) concentrations, all from baseline to last available measurement, upon stratification according to severe, moderate or mild LoF classification. These parameters were selected based on their clinical relevance and availability of sufficient observations across different LoF classifications.
Selection of SLC16A2 variants in unaffected populations
We screened for non-synonymous variant data from control-only individuals in gnomAD, a database that aggregates sequencing studies38. Because individuals with pediatric disorders are excluded from gnomAD, and because these individuals were specifically accrued as unaffected controls, they were assumed to be free of MCT8 deficiency. Variants that occurred in at least two male individuals and had an allele count >10 were included.
Meta-analysis and genotype-phenotype analyses
We utilized data from patients with MCT8 deficiency through our international consortium consisting of 53 sites in 23 countries. To this cohort we added patients identified through a systematic literature review (up to 01-01-2020), for whom data on clinical outcomes were extracted from the original publication. Data accrued from the international consortium on MCT8 deficiency and from the literature review were assembled into one database using a uniform coding for all parameters.
All disease-causing and benign MCT8 variants were functionally tested, except for variants that lead to a premature truncation before transmembrane domain (TMD) 12 as such truncations have been previously shown to be fully inactive39,40; hence, these mutations were regarded as having 0% residual thyroid hormone transport. Patients with splice site variants were excluded from clinical correlation analyses, as the impact of such variants on splicing efficacy can be heterogeneous across tissues and therefore difficult to predict in cell-based models.
Our objective was to correlate residual transport activity of pathogenic MCT8 variants in transfected COS-1 (primary model) and JEG-3 cells (confirmatory model), and patient-derived fibroblasts with disease features. Patients were stratified across different LoF classifications: severe LoF ( < 20% residual T3/T4 transport as determined in transfected COS-1 cells and <5% residual T3/T4 transport in transfected JEG-3 cells), moderate LoF (20–40% residual T3/T4 transport in transfected COS-1 cells and 5–10% residual T3 transport in transfected JEG-3 cells) and mild LoF (40–75% (T3) or 40–65% (T4) residual transport in transfected COS-1 cells and 10–50% (T3) or 10–40% (T4) residual transport in transfected JEG-3 cells). The LoF classifications were chosen to enable relevant discrimination across groups, guided by limited small-scale functional and clinical interrogations41,42. Due to the limited number of patient fibroblasts (n = 34), severe LoF was defined as <50% and mild LoF as 50–75%. We correlated T3 transport with survival and the following disease characteristics: a. neuro-developmental scores on the subdomains of the Bayley Scales of Infant Development (BSID)-III34, Gross Motor Function Measure (GMFM)-88 scale32 and Vineland Adaptive Behaviour Scales (VABS)-II33 as well as clinical features (attainment of head control, sit, walk or speech); b. neurological features (hypotonia, primitive reflexes, muscle hypoplasia, dystonia, spasticity, plantar extension response, seizures, delayed myelination, microcephaly); c. thyrotoxic signs (underweight, short stature, feeding status, heart rate, premature atrial complexes, relevant cardiac abnormalities (arrhythmia, abnormal conduction, or prolonged QTc), systolic blood pressure, diastolic blood pressure; d. biochemical measurements (T3, FT4, rT3, TSH, SHBG, CK, total cholesterol); e. treatment effects of Triac on T3, FT4, TSH, SHBG, body weight and heart rate.
Statistical procedures
We summarised continuous variables as mean (SD) or median (range). Survival was defined as the age at the last date known alive. In analyses of developmental outcomes, patients who were not anticipated to have reached the outcomes on the age of assessment (based on development of healthy individuals) were excluded. Residual transport capacity was set to 0% for large deletions and premature frameshifts (protein termination before residue 575 has been shown deleterious previously)40. Patients with splice site variants were excluded from clinical correlations.
The degree of thyroid hormone (T3 and T4) transport activity of MCT8 variants in transfected COS-1 and JEG-3 cells or patient-derived fibroblasts was correlated with survival and 32 disease features upon stratification across abovementioned LoF classifications. We assessed overall survival and compared patients with mutations across different LoF classifications using log-rank analysis. Clinical outcomes were compared between three LoF classifications (transfected cells-based stratification) using Chi-square tests (proportional data) or one-way ANOVA with Tukey’s posttests (continuous data), and between two LoF classifications (fibroblast-based stratification) using Students T-tests; or their non-parametric alternatives. Descriptive statistics and scatterplots were generated for variables used in the analyses to ensure that the data met the criteria for the use of parametric tests. In case the normality assumption was not met, non-parametric tests were utilized. All analyses were performed using Graphpad Prism (version 9.0), and p values ≤ 0.05 were considered significant.
Functional studies
Materials
Nonradioactive iodothyronines, silychristin, bovine serum albumin (BSA), and D-glucose were obtained from Sigma Aldrich (Zwijndrecht, The Netherlands [NL]). [125I]-T3 and [125I]-T4 were produced as previously described (e.g. ref.9,43). An overview of the antibodies is provided in Supplementary Table 8. Vectashield H-1200 containing 4′,6-diamidino-2-phenylindole (DAPI) was obtained from Brunschwig (Amsterdam, NL). All cell culture flasks and plates were obtained from Greiner Bio-one (Alphen aan den Rijn, NL). X-tremeGENE9 transfection reagent was obtained from Roche Diagnostics (Woerden, NL). Sulfo-NHS-biotin was obtained from Gentaur (Eersel, NL). Neutravidin agarose was obtained from Thermo Fisher scientific (Bleiswijk, NL).
Plasmids
Cloning of human MCT8 in pcDNA3, and of the human cytosolic thyroid hormone-binding protein mu-crystallin (CRYM) in pSG5, has been described previously10,43. The generation of a wild-type (WT) human MCT8 expression construct containing a 227-nucleotide extension of the 3’UTR (further referred to as 3’UTR-MCT8) has been described before44. The indicated variants were introduced using QuikChange site-directed mutagenesis according to manufacturer’s protocol (Stratagene, Amsterdam, NL). Primer sequences are available upon request. In line with previous studies40, the 3’UTR-MCT8 construct was used as a template for all frameshift variants that resulted in an alternate reading frame that exceeded the natural stop codon of MCT8, whereas the regular MCT8 expression construct was used as a template for all other variants. The position of the mutations is indicated using the NM_006517.3 reference sequence and uses +1 as the A of the ATG translation initiation codon of the long MCT8 isoform, with the initiation codon as codon 1. DNA sequencing confirmed the presence of the introduced mutations and the absence of unintended mutations.
Cell culture and transfection
COS-1 African green monkey kidney (CVCL_0223) and JEG-3 human choriocarcinoma (CVCL_0363) cells were obtained from ECACC (Sigma-Aldrich) and were cultured and transiently transfected as previously described44. For thyroid hormone uptake studies, COS-1 or JEG-3 cells were cultured in 24-well plates, and transiently transfected at 70% confluence with 100 ng pcDNA3 empty vector (EV), or 100 ng WT or indicated mutant MCT8 expression construct in the presence or absence of 50 ng CRYM. We have previously excluded the presence of functional differences between the regular WT MCT8 and 3’UTR-MCT8 constructs40. Determination of optimal plasmid doses have been previously described16. For surface biotinylation studies, cells were seeded in 6-well plates (6 wells per condition, which were pooled during lysate preparation) and transiently transfected with 500 ng pcDNA3 EV, WT or indicated mutant MCT8 per well. For immunocytochemistry, JEG-3 cells were cultured in 24-well dishes on 10-mm glass coverslips coated with poly-D-lysine (Sigma-Aldrich).
Human fibroblasts were derived from skin biopsies obtained during routine clinical practice and cultured in Dulbecco’s modified Eagle medium/F12 medium (Invitrogen, Breda, NL), containing 9% heat-inactivated fetal bovine serum (Invitrogen, Breda, NL), 2% penicillin/streptomycin (Roche). For uptake studies, fibroblasts were seeded in 6-well plates and grown until >95% confluence16.
Thyroid hormone transport studies
Thyroid hormone transport studies were performed using well-established protocols (e.g. ref.45). Cells were washed once with incubation buffer (D-PBS+Ca2 + /Mg2+ supplemented with 0.1% glucose and 0.1% BSA) and incubated in incubation buffer containing 1 nM (50,000 cpm) [125I]-T3 or [125I]-T4 for 30 min. Cells were then briefly washed with incubation buffer and lysed in 0.1 M sodium hydroxide. The internalized radioactivity was measured with a gamma-counter. Thyroid hormone uptake levels in human fibroblasts were corrected for total protein concentrations as measured by Bradford assay according to manufacturer’s guideline (Bio-Rad, Veenendaal, NL). To determine residual MCT8 activity in human fibroblasts, T3 uptake was determined in the presence of 10 µM silychristin, a well-established MCT8-specific inhibitor16,46.
Surface biotinylation and immunoblotting
Cell surface biotinylation studies were performed according to well-established protocols16,45. Cell surface proteins were labeled with Sulfo-NHS-biotin and lysed in IP buffer (50 mM Tris-HCl, 150 mM NaCl, 10 mM EDTA, 1% Triton X-100), containing protease inhibitor cocktail (Roche). After brief sonication, samples were clarified from nuclear debris by centrifugation (15000xg for 10 min). A 5% aliquot was used as an input control. Cell surface proteins were isolated using Neutravidin agarose beads (Thermo Fisher Scientific) and eluted in NuPAGE 1x lithium dodecyl sulfate (LDS) loading buffer (Thermo Fisher Scientific) containing 10 mM DTT by incubating the beads for 5 min at 90 °C prior to immunoblot analyses. Samples were analyzed by immunoblotting as previously described16,47, using antibodies listed in Supplementary Table 8 and Odyssey detection methods40.
Immunocytochemistry
Transiently transfected JEG-3 cells were fixed with 4% paraformaldehyde and permeabilized with 0.25% triton X-100 in PBS 48 h after transfection. Samples were blocked for 1 h at room temperature in PBS containing 2% BSA (Sigma Aldrich), and incubated overnight with rabbit anti-MCT8 (1:1000) and mouse monoclonal ZO-1 antibody (1:500), which served as a membrane marker. After secondary staining with goat anti-rabbit Alexa Fluor 488 (1:1000) and goat anti-mouse Alexa Fluor 633 (1:1000), cover slips were mounted on glass slides with Prolong Gold containing DAPI (Invitrogen) and examined as previously described44.
Alanine scanning
All residues from just prior to the start of TMD1 (Pro169) until the end of TMD12 were mutated to Ala residues using standard mutagenesis procedures (e.g. ref.47). For the loops (Lys207-Gln216; Asp240-Thr247; Thr265-Ser269; Asp329-Thr336; Arg355-Asn386; Met417-Ile427; Pro456-Gly457; Ile478-Leu480; Glu511-Pro515; Phe547-His551) we created Ala blocks encompassing up to 5 residues. If residual transport of an Ala block was <50%, we mutated all individual residues in the block to Ala. Small loops were tested as individual variants. Functional evaluation of Ala variants was performed in JEG-3 cells using T3 and T4 as a substrate.
Genetic look-up of the SLC16A2 gene
For the lookup, the X-linked SLC16A2 gene was selected. All SNPs located within +/−100kb of the gene’s transcription start and end site were included in the lookup (TSH men and women N = 356, TSH men N = 339, TSH women N = 340; FT4 man and women N = 362, FT4 men N = 344, FT4 women N = 343). Filters on minor allele frequency (MAF) > 1% and imputation quality >0.4 were applied and a false discovery rate (FDR) of 5% was used to correct for multiple testing. We selected TSH and FT4 as main traits as thyroid function tests are abnormal in virtual all patients with MCT8 deficiency. For TSH (N = 54,288) and FT4 (N = 49,269), the summary statistics of the sex-specific and joint (both sexes) GWAS meta-analyses from Teumer et al. were used48. For the chromosome X analyses, an additive genetic association model was calculated coding females as 0/1/2 and males 0/2, assuming full genetic dosage compensation, depending on the number of alleles on both or one chromosome X respectively49. Individuals with TSH values outside the cohort-specific reference range, who underwent thyroid surgery, or taking thyroid medication (ATC code H03) were excluded from all analyses.
Pre-imputation quality checks included SNPs with a call rate ≥ 95% and HWE p-value > 10-4 and minor allele frequency ≥ 0.01. Further information on quality control checks and meta-analysis of the on TSH and FT4 is described in detail elsewhere48.
When significant results were found (FDR < 5%) for a specific trait in the sex-specific or joint analyses, additional clumping using PLINK v1.9 was performed on all SNPs in the look-up region for each analysis (i.e. males, females, both sexes) separately, assessing independently associated SNPs with UKBB as a reference (14k individuals). To include all SNPs in the clump, final significance threshold filters (p1 and p2) were set to default 1. In order to remove too correlated SNPs, no pair of SNPs survived the clump with a squared correlation above 0.01 within a window of 1 Mb. Afterwards a FDR was applied and SNPs with a FDR < 5% were considered significant. For applying Bonferroni multiple testing correction, the number of statistically independent SNPs in the specific MCT8 region was calculated using the indep option in PLINK on all SNPs in the look-up region of the specific trait. This method removes correlated SNPs (based on a multiple correlation coefficient and the (LD)). A 2000kb window shifted by 5 consecutive SNPs, and a variation inflation factor of 5 (R2 = 0.8) were selected as parameters. The total count of independently associated SNPs in the look-up region was used in the Bonferroni equation (0.05/independent SNPs), as a more conservative multiple testing correction. Furthermore, SNPs were also checked if passing nominal significance (p < 0.05). Altogether, three SNPs were selected (rs150010878 (both sexes), rs4892386 (males only) and rs67736575 (females only)) that were significantly associated with FT4 concentrations. Given the high correlation between rs150010878 and rs4892386 (r2 = 0.98 in the European set of the 1000 genomes reference panel), follow-up analyses were only performed for rs4892386 and rs67736575.
The association of the two selected SNPs was then assessed in the UKBB, using accession IDs: 67864 and 27412]50. The UK Biobank (https://www.ukbiobank.ac.uk) is a multi-site cohort study consisting of 502,655 individuals aged between 40 and 69 years at baseline. The study was approved by the National Research Ethics Committee, reference 11/NW/0382, and informed consent was obtained from all participants as part of the recruitment and assessment process. Using accession ID 67864, sex hormone binding globulin (SHBG, n = 353,029 [46% females]), body mass index (BMI, n = 406,975 [46% females]), electrocardiogram heart rate during exercise (ECG, n = 56,186 [46% females]) and fluid intelligence score (n = 130,134 [46% females]) were assessed assuming an additive model, adjusting for (sex), age, research center, genotyping platform and 10 genomic principal components in individuals of European ancestry using SAIGE51. A similar approach was followed for brain outcomes, under accession ID 27412. Briefly, 70 different brain traits including cortical thickness, surface areas52, subcortical volumes and fiber tract anisotropy variables derived from MRI (n = ~32,000) were tested using FastGWA on the chromosome X53. Assuming an additive model, joint and sex-specific analyses were adjusted for (sex), age, Euler number, 10 genomic principal components, BrainDx, mean cortical thickness and total surface area. In addition, gene-based analysis were also carried out using GCTA-fastBAT which performs a set-based enrichment analysis using GWAS summary statistics while accounting for linkage disequilibrium (LD) between SNPs of a particular region54. For sex-specific analyses only females or males present in this subsample were used to create sex-specific reference LD panels. Multiple testing adjustment was carried out and is reported as follows. Multiple-testing adjustment was applied at 3 levels, nominal P < 0.05, denoted by *; categorical denoted by **, (i.e., Metabolic [TSH, FT4, SHBG, BMI, ECG]; P < (0.05)/(5 traits*2 SNPs)) = P < 0.005. Brain outcomes [fluid intelligence and surface area sizes of brain regions], P < (0.05)/(13 traits*2 SNPs)) = P < 0.0019); and study-wise, denoted by ***, P < (0.05)/(18 traits *2 SNPs)) = P < 0.014. Additional analyses of other explored traits are also shown on the Supplementary Fig. 11, where P < 0.05 is nominally significant; specific area significance (i.e., Specific brain thickness P < (0.05)/(11 traits*2 SNPs) = P < 0.0023. Subcortical volumes P < (0.05)/(20 traits* 2 SNPs)) = P < 0.00125. Fiber tract anisotropy, P < (0.05)/(27 traits* 2 SNPs)) = P < 0.0009). All brain MRI outcomes were adjusted for global brain sizes.
In silico analyses
Conservation analyses
Conservation analyses of protein homologs were performed using the ConSurf server55, using HMMER as homolog search algorithm, 1 iteration, an E-value cutoff of 0.0001 and UniProt used as protein database. Homologs were selected automatically by the server. All sequences closest to the reference sequence with a %ID between 35 and 100% were selected for analyses and aligned using the MAFFT-L-INS-I method. Bayesian calculation was performed using the best evolutionary substitution model. The long isoform (NP_006508.1) was used for all conservation analyses. The MCT8 subtree was extracted from the collected sequences using WASABI56 and reanalyzed using the ConSurf server afterwards (conservation score 1). For conservation score 2, mammalian sequences were extracted manually, a multiple sequence alignment of these sequences was created using ClustalOmega57 and analyses were performed using Bayesian calculation with the best evolutionary substitution model. Conservation scores 3 & 4 were calculated similarly as conservation score 2, after creation of multiple sequence alignments of the selected sequences.
MCT8 homology modelling
Structural models of the MCT8 protein were constructed using YASARA Structure, using previously described methods47. A novel hybrid MCT8 homology model was generated based on the Cryo-EM structures of MCT1 (Protein Data Bank [PDB]# 6LZ0, 7CKR, 6LYY) and MCT2 (PDB# 7BP3), as well as the crystal structure of the major facilitator superfamily protein FucP (PDB# 3O7Q) and bacterial MFS (PDB# 6HCL), using the homology modelling macro of YASARA Structure58. A T4 substrate molecule was docked at the substrate binding pocket, using the ligand docking tool implemented in YASARA, which is based on a derivative of Autodock59, and the MCT8-T4 complex was embedded in a lipid bilayer using a previously described approach47. The resulting model was compared with the MCT8 model derived from AlphaFold260.
All disease-causing missense variants identified through our international consortium and meta-analysis were modelled individually in the MCT8 structural model and their apparent impact was visualized using previously described methods61. Moreover, the ddG of each possible amino acid substitution was calculated using MAESTRO62 and FoldX63. For this purpose, we used the MCT8 structure without membrane embedding, to reduce potential artefacts introduced during membrane embedding.
The following parameters were derived and used as independent structural features in establishing the variant prediction tool. First, the membrane interaction surface area was derived by computing the molecular surface between MCT8 and the lipid bilayer. Second, the substrate interaction surface area was derived by computing the molecular surface between the MCT8 protein and the T4 molecule modelled at the substrate binding center. Third, the surface accessible surface area was determined by computing the molecular surface between MCT8 and the surrounding water solvent. For this purpose the substrate molecule was deleted from the soup, allowing maximal exposure of the residues in the substrate channel to the surrounding water molecules. Fourth, the flexibility of each residue was determined by calculating the RMSD after running a molecular dynamic simulation of 1 ns using a YASARA 2 force field. Finally, the distance to the T4 substrate molecule was calculated for each residue.
Using a similar approach, a novel MCT8 structure in the inward-open conformation was modeled, based on the inward-open cryo-EM structures of MCT1 (PDB# 7CKO and 7DA5) and MCT2 (PDB# 7BP3), and the bacterial MFS (PDB#6HCL).
Substrate transition through the substrate pore was modeled using the morphing macro embedded in YASARA Structure.
All images were created using YASARA Structure and Pov-Ray v3.6 software (www.povray.org).
MCT8 reference sequence
The nomenclature of all MCT8 variants at cDNA and protein level were based on the following reference sequences, which represent the longest isoform of MCT8 mRNA and protein: NM_006517.3 (mRNA) and NP_006508.1 (protein).
Dual pathogenicity and severity classifier for MCT8 variants
The MCT8 Pathogenicity Classifier was built based on unsupervised learning, relying on conservation of proteins across species19 and supervised machine learning, using a similar approach as described previously64. The two approaches were integrated by utilizing the outcomes of the unsupervised machine learning (evolutionary indices) as a feature in the supervised machine learning approach. One algorithm discriminated between benign and pathogenic variants, and a subsequent algorithm segregated predicted pathogenic variants in mildly pathogenic or combined moderately and severely pathogenic.
Unsupervised Machine Learning
Evolutionary indices were built following the principles and methods described in Frazer et al.19, and were optimized for MCT8. Results were obtained by ensembling 10 random initialisations of the variational autoencoder.
Supervised and Integrated Machine Learning
Feature engineering
Impact of amino acid substitution: The impact of amino acid substitution was quantified using 91 substitution scoring matrices available in AAindex2 database65.
Sequence-based scores: 4 different conservation scores were built using different sequence alignments (see section ‘Conservation analyses’).
Structural features: a total of 37 structural features were built, all of them were calculated using three different models: homology model in the inward-open conformation, homology model in the outward-open conformation (see section ‘MCT8 homology modelling’) and AlphaFold2 model60. Topology features were determined by visualization. Surface accessible areas were calculated using YASARA Structure (see section ‘MCT8 homology modelling’). Center of Mass was calculated using Pymol. Changes in dG were calculated using MAESTRO and FoldX66.
MCT8-specific variant classifier: A total of 480 validated MCT8 variants with 134 features, including evolutionary indices built as described in section ‘Unsupervised Machine Learning’, were used as the initial dataset to develop the two-steps classifier. The data was normalized using the Standard Scaler function of the pre-processing package of sckit-learn [Scikit-learn: Machine Learning in Python67]. Features were selected performing a Recursive Feature Elimination (RFE) using as model method a Logistic Regressor Algorithm and keeping the top ranked.
For the first classifier, 9 features were selected: LINK010101 score, GEOD900101 score, DAYM780301 score, Intracellular Loop residue, Extracellular Loop residue, Transmembrane domain residue, evolutionary index, FoldX ddG calculated on the homology model in the outward-open conformation, Mean distance to substrate calculated on the homology model in the outward-open conformation. A Logistic Regressor classifier to discriminate between Benign and Pathogenic MCT8 missense variants (Relative Activity cut-off = 50%) was developed using the scikit-learn library (Scikit-learn: Machine Learning in Python67). With 36% residual uptake as the highest residual T4 uptake in patient variants expressed in JEG3 cells, a 40% as upper limit was used in the alanine scanning (see below). An additional 10% was added to the Relative Activity cut-off, resulting in a cut-off of 50%, to limit the possibility to miss out potential novel patients with milder phenotypes. Hyperparameter tuning was performed using a Grid Search (optimizing the f1 score) obtaining the best parameters fitting the model: C = 1, penalty=l2 (Ridge), solver=saga; the remaining parameters were kept as the default model. Ten-fold cross-validation was used for assessing the performance of the model. To check if the model had merely ‘memorized’ highly conserved sites, we also evaluated the performance of the classifier by 10-fold cross-validation splitting the dataset by positions; we did not find relevant differences in performance metrics (see Supplementary Fig. 32).
For the second classifier, we only used those variants with relative activity below 50%. A total of 22 features were selected: Membrane Interacting Surface Area calculated on the homology model in the outward-open conformation, Substrate Channel Surface Area calculated on the homology model in the inward-open conformation, Membrane Interacting Surface Area calculated on the homology model in the inward-open conformation, Conservation Score across all MCT8 sequences, MEHP950101 score, OVEJ920103 score, FEND850101 score, LUTR910107 score, FITW660101 score, JOHM930101 score, MOHR870101 score, KOSJ950107, CSEM940101 score, DOSZ010103 score, KOSJ950101 score, GIAG010101 score, KOSJ950114 score, Residue in a Substrate Interaction Surface, evolutionary index, Transmembrane domain residue, Residue with Substrate Interaction, Residue in an alpha Helix. A Logistic Regressor classifier to discriminate between Moderate Pathogenic and Severe Pathogenic MCT8 missense variants (Relative Activity cut-off = 10%) was developed using the scikit-learn library. Hyperparameter tuning was performed using a Grid Search obtaining the best parameters fitting the model: C = 10, l1_ratio=0.4, penalty=elasticnet, solver=saga; the remaining parameters were kept as the default model. Ten-fold cross-validation was used for assessing the performance of the model. To check if the model had merely ‘memorized’ highly conserved sites, we also evaluated the performance of the classifier by 10-fold cross-validation splitting the dataset by positions; we did not find relevant differences in performance metrics (see Supplementary Fig. 32).
We evaluated feature relevance by performing a feature permutation importance inspection, and found evolutionary scores and amino acid properties being most important (Supplementary Fig. 33)).
Visualization: Figures were created using SeaBorn Python Library68.
Reporting summary
Further information on research design is available in the Nature Portfolio Reporting Summary linked to this article.