In vitro transcription and polyadenylation
Set of transcripts with well-defined poly(A) tail were prepared in vitro by T7 RNAP (WT, mutant: G47A + 884G47). Templates for IVT were prepared in consecutive PCR reactions. First, transcript body comprising a fragment of Renilla luciferase was amplified from pClneo-NHA plasmid carrying pRL-5BoxB (Renilla luciferase containing five BoxB structures) with primers comprising specific to Renilla sequence and overhang necessary for PCR2 (RLucX_F1/RLucX_R1) with the following primers:
RLucA_F1: GCCATCAGATTGTGTTTGTTAGTCGCTATGATTCCGAGAAGCACGCCGAGAAC
RLucA_R1: GCTTACGGTTCACTACTCACGACGATGGGACGATGGCCTTGATCTTGTCTTGG
RLucB_F1: GCCATCAGATTGTGTTTGTTAGTCGCTGCTTGTCTGGCCTTTCACTACTCCTACG
RLucB_R1: GCTTACGGTTCACTACTCACGACGATGGTCGGGCTTGCCTCCCTTAACGAGAG
RLucSh_F1: GCCATCAGATTGTGTTTGTTAGTCGCTCTGGAGCCATTCAAGGAGAAG
RLucSh_R1: GCTTACGGTTCACTACTCACGACGATGTTACTGCTCGTTCTTCAGCACGCG
The purified amplicon was a template for PCR2 where T7 promoter sequence on primer add T7_F2 and a variant of poly(A) tail A60_x30_R2/A60_R2 were introduced with the following primers:
addT7_F2: TAATACGACTCACTATAGGGAGAGCCATCAGATTGTGTTTGTTAGTCGCT
A60_c30_R2: TTTTTTTTTTTTTTTTTTTTTTTTTTTTTTGTTTTTTTTTTTTTTTTTTTTTTTTTTTTTGCTTACGGTTCACTACTCACGACGATG
A60_g30_R2: TTTTTTTTTTTTTTTTTTTTTTTTTTTTTTCTTTTTTTTTTTTTTTTTTTTTTTTTTTTTGCTTACGGTTCACTACTCACGACGATG
A60_u30_R2: TTTTTTTTTTTTTTTTTTTTTTTTTTTTTTATTTTTTTTTTTTTTTTTTTTTTTTTTTTTGCTTACGGTTCACTACTCACGACGATG
A60_R2: TTTTTTTTTTTTTTTTTTTTTTTTTTTTTTTTTTTTTTTTTTTTTTTTTTTTTTTTTTTTGCTTACGGTTCACTACTCACGACGATG
In this step, the products with the following sequences were obtained:
RLucB-A60c30: GCTTGTCTGGCCTTTCACTACTCCTACGAGCACCAAGACAAGATCAAGGCCATCGTCCATGCTGAGAGTGTCGTGGACGTGATCGAGTCCTGGGACGAGTGGCCTGACATCGAGGAGGATATCGCCCTGATCAAGAGCGAAGAGGGCGAGAAAATGGTGCTTGAGAATAACTTCTTCGTCGAGACCATGCTCCCAAGCAAGATCATGCGGAAACTGGAGCCTGAGGAGTTCGCTGCCTACCTGGAGCCATTCAAGGAGAAGGGCGAGGTTAGACGGCCTACCCTCTCCTGGCCTCGCGAGATCCCTCTCGTTAAGGGAGGCAAGCCCGACGTAGCAGCACTCATCACTTGGCATTCGTTTTTTTTTTTTTTTTTTTTTTTTTTTTTGTTTTTTTTTTTTTTTTTTTTTTTTTTTTTT
Rluc-sh_A60-g30:
GGAGCCATTCAAGGAGAAGGGCGAGGTTAGACGGCCTACCCTCTCCTGGCCTCGCGAGATCCCTCTCGTTAAGGGAGGCAAGCCCGACGTCGTCCAGATTGTCCGCAACTACAACGCCTACCTTCGGGCCAGCGACGATCTGCCTAAGATGTTCATCGAGTCCGACCCTGGGTTCTTTTCCAACGCTATTGTCGAGGGAGCTAAGAAGTTCCCTAACACCGAGTTCGTGAAGGTGAAGGGCCTCCACTTCAGCCACGAGGACGCTCCAGATGAAATGGGTAAGTACATCAAGAGCTTCGTGGAGCGCGTGCTGAAGAACGAGCAGTAA GTAGCAGCACTCATCACTTGGCATTCGTTTTTTTTTTTTTTTTTTTTTTTTTTTTTCTTTTTTTTTTTTTTTTTTTTTTTTTTTTTT
RlucA-A60_u30:
ATGATTCCGAGAAGCACGCCGAGAACGCCGTGATTTTTCTGCATGGTAACGCTGCCTCCAGCTACCTGTGGAGGCACGTCGTGCCTCACATCGAGCCCGTGGCTAGATGCATCATCCCTGATCTGATCGGAATGGGTAAGTCCGGCAAGAGCGGGAATGGCTCATATCGCCTCCTGGATCACTACAAGTACCTCACCGCTTGGTTCGAGCTGCTGAACCTTCCAAAGAAAATCATCTTTGTGGGCCACGACTGGGGGGCTTGTCTGGCCTTTCACTACTCCTACGAGCACCAAGACAAGATCAAGGCCATCGTCCGTAGCAGCACTCATCACTTGGCATTCGTTTTTTTTTTTTTTTTTTTTTTTTTTTTTATTTTTTTTTTTTTTTTTTTTTTTTTT
RlucA-A60:
ATGATTCCGAGAAGCACGCCGAGAACGCCGTGATTTTTCTGCATGGTAACGCTGCCTCCAGCTACCTGTGGAGGCACGTCGTGCCTCACATCGAGCCCGTGGCTAGATGCATCATCCCTGATCTGATCGGAATGGGTAAGTCCGGCAAGAGCGGGAATGGCTCATATCGCCTCCTGGATCACTACAAGTACCTCACCGCTTGGTTCGAGCTGCTGAACCTTCCAAAGAAAATCATCTTTGTGGGCCACGACTGGGGGGCTTGTCTGGCCTTTCACTACTCCTACGAGCACCAAGACAAGATCAAGGCCATCGTCCGTAGCAGCACTCATCACTTGGCATTCGTTTTTTTTTTTTTTTTTTTTTTTTTTTTTTTTTTTTTTTTTTTTTTTTTTTTTTT
Product of PCR2 was analyzed and purified over agarose gel with GeneJet Gel Extraction Kit (Thermo Fisher Scientific; cat. no: K0691). RNA was prepared at 37 °C for 1.5 h in 50 µl reaction mix containing: 600 pmols template, 1× buffer (200 mM Tris-HCl, 30 mM MgCl2, 10 mM spermidine, 50 mM NaCl), 5 µl of rNTPs mix (20 mM each), 5 µl of 100 mM DTT, 0.5 µl of 1% Triton X-100, 80U ribonuclease inhibitor and homemade T7 RNAP. Next, 4U of DNAse TURBO (Ambion; cat. no: AM2238) was added to the reaction mixture and after 15 min the reaction was terminated with EDTA pH 8.0 (final 25 mM). RNA was cleaned on KAPA Pure Beads (Roche; cat. no: KK8001), concentration was assessed with Qubit RNA high sensitivity (Thermo Fisher Scientific; cat. no: Q32852) protocol, visualized by denaturing electrophoresis, and sequenced via nanopore.
In vitro polyadenylation
RNA for in vitro polyadenylation was transcribed from PCR templates LacZ_F1/R1, prepared similarly as described above, except they were not coding for poly(A) tail. The sequences of primers were as follows:
LacZ_F1:
GCCATCAGATTGTGTTTGTTAGTCGCTATGGTCGTTTTACAACGTCGTGACTG
LacZ_R:
GCTTACGGTTCACTACTCACGACGATGGCCATCAAAAATAATTCGCGTCTGGCC
3’-naked RNAs were transcribed with T7 polymerase as described above, cleaned on KAPA Pure Beads (Roche; cat. no: KK8001) and examined on denaturing gel. 500 ng of RNA was polyadenylated either in presence of ATP only or rNTPs (in equimolar concentration or in ratio CTP:GTP:UTP:ATP 1:3.3:2.7:2346) by Escherichia coli PAP polymerase (New England Biolabs; cat. no: M0276) in 20 µl reaction for 30 min at 37 °C, according to manufacturer’s protocol. The reaction was stopped with EDTA pH 8.0 (final 10 mM), purified RNA was measured with Qubit RNA high sensitivity (Thermo Fisher Scientific; cat. no: Q32852) protocol, visualized by denaturing electrophoresis, and used to prepare libraries.
Caenorhabditis elegans cultures and RNA extraction
The population of wild-type C. elegans strain (N2 Bristol) was synchronized by bleaching of gravid adults and seeding isolated embryos on NGM plates with E. coli HB101. Worms were then kept at 20 °C until they reached the L4 stage. Synchronized worms were collected from plates 55 h after the embryos seeding (10 h after entering the L4 stage) and washed three times using 50 mM NaCl. Worm pellet was then suspended in 1 ml of TRIReagent (Sigma-Aldrich; cat. no: T9424), vortexed for 15 min at room temperature and stored in −80 °C before the RNA isolation. Samples were prepared in two independent biological replicates. RNA was isolated following the manufacturer’s instructions and cap-enrichment of mRNA was performed as described previously30. Briefly, total RNA was incubated with gluthatione sepharose 4B resin (GE Healthcare; 17-0756-01) bound to purified GST-eIF4E K119A protein for 1 h at RT. Then RNA was washed three times with buffer B (10 mM potassium PB, pH 8.0, 100 mM KCl, 2 mM EDTA, 5% glycerol (Sigma-Aldrich), 0.005% Triton X-100 (Sigma-Aldrich), 6 mM DTT (A&A Biotechnology), and 20 U/mL Ribolock RNase Inhibitor (Thermo Fisher Scientific, EO0381), twice with buffer B supplemented with 0.5 mM GDP (Sigma-Aldrich), and two times with buffer B without GDP. RNA was eluted from the resin by acid phenol:chloroform extraction followed by ethanol precipitation. Nanopore direct RNA sequencing libraries were prepared from 4 µg of cap-enriched mRNA. To increase the efficiency of the sequencing, 150 ng of oligo-(dT)25-enriched mRNA from Saccharomyces cerevisiae and 2 ng of standards with predefined poly(A) lengths were added to each library30.
Mice lines
All mice lines were generated by the CRISPR/Cas9-based method at the Genome Engineering Unit (https://geu.iimcb.gov.pl/)30,31,49. Briefly, a conditional knockout Tent5aFlox/Flox (C57BL6;CBA-Tent5aem2IIMCB/Tar) mouse line was created by insertion of LoxP sites in introns flanking exon 2, which contains triplets encoding the catalytic center of the protein (D144N and D146N). Cas9-generated double-strand breaks in gDNA were targeted using two chimeric sgRNA. BamHI or HindIII restriction sites were inserted next to LoxP sites to facilitate genotyping. Whereas a knockout Tent5c−/− (C57BL6;CBA-Tent5cem1IIMCB/Tar) mouse line was created by generating a random indel mutation within the only coding exon of the protein, destroying its catalytic center (Cys88fs26*). Double Tent5aFlox/Flox Tent5c−/− mouse line was created by crossing aforementioned Tent5aFlox/Flox conditional knockout with the Tent5c−/− knockout line49. Desired mutations were confirmed by Sanger sequencing and followed by genotyping with the following primers31:
Fw primer for genotyping of Tent5a KO mouse line: CAAGCCTGATTGTGAAGGTG
Rv primer for genotyping of Tent5a KO mouse line: AAGGAAGAGAAGGAAACGCA
Fw primer for genotyping of Tent5c KO mouse line: AGGTCCTGACTGAGGTCGTG
Rv primer for genotyping of Tent5c KO mouse line: TTCCTCAAAATCCCCGTACA
sgRNA1 (Tent5aFlox/Flox): TATGGGCGTCACGATCGGGG
sgRNA2 (Tent5aFlox/Flox): ACTAATGCGCGTGAGTGGTG
sgRNA (Tent5c−/−): CGGCTTGGGTTGCAAAGATC.
Mice were housed in the animal facility of the Faculty of Biology, University of Warsaw, in conventional polypropylene cages containing wood chip bedding supplied with nesting material and paper tubes. A 12/12 h light cycle was maintained in the room, with at least 15 air changes per hour, 55% ± 10%, relative humidity, and the 22 °C ± 2 °C temperature. The animals were fed and hydrated ad libitum (Labofeed B, Morawski). Regular health monitoring was conducted at the IDEXX laboratory.
All experiments involving animals were approved by the II Local Ethical Committee in Warsaw (decision no: WAW2/71/2021, WAW2/129/2021, WAW2/95/2022, WAW2/127/2022, and WAW2/007/2023) and were performed according to Polish Law (Act no: 653 266/15.01.2015), and in agreement with the corresponding European Union directive.
Murine B cells cultures and RNA extraction
Isolation and cultivation of primary splenic B cells from 2 wild-type female mice was performed as described in Bilska et al.30. Briefly, 12–16 weeks old animals were sacrificed by cervical dislocation. A single-cell suspension of splenocytes was obtained by mechanical tissue disintegration of the spleen through a 70 µm cell strainer. Then, splenocytes were additionally depleted from red blood cells using ACK lysis buffer before separation. Naive B cells were isolated from spleen using immunomagnetic negative selection with EasySep Mouse B Cell Isolation Kit (Stemcell; cat no: 19854) according to the manufacturer’s instructions. Cells were then activated with 20 µg/ml LPS (Sigma-Aldrich; cat. no: L2630). As these cells were used as a control in an unrelated project, they were transduced with pMSCV retroviral construct encoding scrambled shRNA and GFP to determine transduction efficiency. 72 h after transduction, cells were sorted using the CytoFLEX SRT (Beckman) cell sorter to collect only the GFP+ fraction of cells (that were efficiently transduced). 3 mln cells were collected and the cell pellet was resuspended in TRIReagent (Sigma-Aldrich; cat. no: T9424). RNA was isolated according to the manufacturer’s protocol. RNA was then purified using KAPA Pure Beads (Roche; cat. no: KK8001) in 1:1.8 RNA to beads ratio. For direct RNA sequencing, 4.3 µg of total RNA from B cells was mixed with 200 ng of oligo-(dT)25-enriched mRNA from S. cerevisiae and standards with predefined poly(A) lengths and used for library preparation. Each sequencing library originates from a single individual.
Murine T cells cultures and RNA extraction
Wild-type female mouse was sacrificed at age of 12 weeks by cervical dislocation. A single-cell suspension of splenocytes was obtained by mechanical tissue disintegration of the spleen through a 70 µm cell strainer. Then, splenocytes were additionally depleted from red blood cells using ACK lysis buffer before separation. Naive T cells were isolated with EasySep Mouse T Cell Isolation Kit (StemCell; cat. no: 19851) and stimulated with Dynabeads Mouse T-Activator CD3/CD28 Kit (Invitrogen; cat. no: 11452D) according to manufacturer’s instruction. Primary cells were cultured in RPMI 1640 ATCC’s modified (High Glucose, Low Sodium Bicarbonate, HEPES, L-glutamine; Invitrogen; cat. no: A1049101) supplemented with 10% FBS (Invitrogen), 100 nM 2-mercaptoethanol (Sigma-Aldrich), penicillin/streptomycin (Sigma-Aldrich), with 4:1 activator beads to cell ratio. Total RNA was isolated from T cells with TRIReagent (Sigma-Aldrich; cat. no: T9424) according to the manufacturer’s instructions. A 5 µg of EIF4E-enriched mRNA from T cells mixed with 250 ng of oligo-(dT)25-enriched mRNA from S. cerevisiae and standards with predefined poly(A) lengths was used for the preparation of library.
Murine bone marrow-derived macrophages cell cultures and RNA extraction
Primary BMDM cell cultures were established from bone marrow monocytes isolated from 6 Tent5aFlox/Flox/Tent5c−/− and 6 wild-type mice. Young adult animals of both sexes (12–25 weeks old) were sacrificed by cervical dislocation, after which femurs and tibias were isolated, and bone marrow was harvested using a centrifugation-based protocol. Material isolated from multiple individuals (siblings of the same sex) was mixed to obtain number of cells sufficient for subsequent analyses. Bone marrow cells were then plated in IMDM medium (Thermo Fisher Scientific; cat. no: 21980065) supplemented with 10% FBS (Gibco), 100 U/ml penicillin/0.1 mg/ml streptomycin solution (Sigma-Aldrich), and 10 ng/ml macrophage colony-stimulating factor (M-CSF, Preprotech; cat. no: 315-02) and cultured at 37 °C in 5% CO2. On the day before the vaccine treatment, 0.5–1 × 10⁶ cells were seeded on a 6-well plate in the abovementioned medium. The 1 µl of Moderna mRNA-1273 in original LNPs formulation was diluted in 150 µl of Opti MEM medium (Thermo Fisher Scientific) at RT. After 10 min the mixture was added dropwise to the cells and gently mixed. Cells were harvested at 0, 4, 12, 24, 48 and 72 h time points. Total RNA was isolated from cells with TRIzol (Thermo Fisher Scientific), according to the manufacturer’s instructions. 3.5–5 µg of total mRNA was mixed with 50–200 ng oligo-(dT)25-enriched mRNA from S. cerevisiae and standards with predefined poly(A) lengths, followed by library preparation.
Murine dendritic cells cultures and RNA extraction
Bone marrow was isolated from the femurs of 6 young adult mice (12–16 weeks old) of both sexes. Material isolated from multiple individuals (siblings of the same sex) was mixed to obtain number of cells sufficient for subsequent analyses. The erythrocytes were lysed with ACK buffer. Cells were then resuspended in RMPI medium (10% heat-inactivated FBS, pen/strep, 1% non-essential amino acids, 50 µM β-mercaptoethanol, 1 mM sodium pyruvate, 2 mM L-glutamine), counted and seeded at a density of 1 ml/ml in non-tissue culture treated Petri dishes (Sarstedt) supplemented with GM-CSF 20 ng/ml and IL-4 10 ng/ml ligands (both from Preprotech, 315-03 and 214-14, respectively) and placed at 37 °C in an atmosphere of 5% CO2 in air. On day 4, 5 ml of growth medium containing GM-CSF 20 ng/ml and IL-4 10 ng/ml was added. On day 7, half of the medium was removed, cells were centrifuged, new medium with GM-CSF 20 ng/ml, IL-4 10 ng/ml was added to the collected (centrifuged) cells and returned to the Petri dish. Two days later, loosely adherent cells and cells in suspension were collected. Total RNA was isolated from cells with TRIzol (Thermo Fisher Scientific), according to the manufacturer’s protocol. 3.5–5 µg of total mRNA was mixed with 50–200 ng oligo-(dT)25-enriched mRNA from S. cerevisiae and standards with predefined poly(A) lengths, followed by library preparation.
Reporting on sex
The sex of mice used to derive cell cultures was not considered in the study design or analysis, as these were not germ line cells, whose transcriptome vary significantly by sex. The sex of the worms was also not included as an experimental factor, as the publicly available datasets used for orthogonal validation (FLAMseq)2 lack information allowing disaggregation by sex.
Nanopore direct RNA sequencing
Sequencing libraries were prepared using Direct RNA Sequencing Kit (cat. no: SQK-RNA002) from Oxford Nanopore Technologies (ONT) according to manufacturer’s protocol. The amount and composition of the input material from biological samples are described in the relevant sections. For crude Moderna mRNA-1273 vaccine, up to 0.5 μg of RNA was used for the library preparation. Sequencing was performed using R9.4.1 RevD flow cells on a MinION device, controlled by MinKNOW software (ONT). Raw sequencing data (fast5 files) were deposited at the European Nucleotide Archive (ENA, accession numbers are listed in Supplementary Data 1).
Basecalling mapping and poly(A) tail delimitation
Raw sequencing reads were basecalled with Guppy, mapped to respective reference using minimap252 (-k 14 -ax map-ont –secondary=no) and processed with samtools53 to filter out supplementary alignments and reads mapping to reverse strand (samtools view -b -F 2320). The poly(A) tail lengths and coordinates were determined using nanopolish polya function18. The mRNA-1273-originating reads were identified using subsequence Dynamic Time Warping and modified nanopolish polya algorithm as described in Krawczyk et al.16. Software versions, references, accession numbers and additional sample characteristics are included in Supplementary Data 1. In subsequent analyses with Ninetails, reads with quality control tag reported by nanopolish as PASS and SUFFCLIP were considered.
Signal transformation strategy
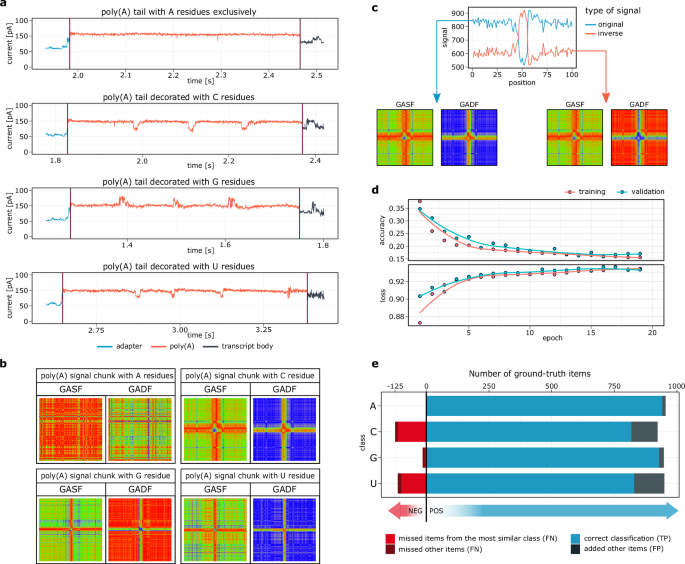
For each sequenced molecule, two data vectors were extracted from the corresponding basecalled fast5 file: (I) the raw signal (i.e., the digital representation of the sequenced molecule) and (II) moves (i.e., metadata provided by Guppy, describing whether a significant change in ionic current (state) occurs between consecutive k-mers). The region of interest (poly(A) tail) was delimited by the nanopolish polya function. The raw signal was then winsorized to remove sequencing artifacts (cliffs). The move data were then scaled along the corresponding signal based on the number of events and stride. Both vectors (signal and move) were then linearly interpolated to 80% to reduce background noise and increase computational speed. The signal was then scanned using the z-score thresholding algorithm41 to identify significantly divergent regions. To reduce the risk of reporting false positives, the following criteria were used to filter out signals potentially containing non-adenosines: (I) signal distortion (anomaly) that was 3.5 standard deviations away from the mean signal values (empirically adjusted), (II) a signal distortion that spanned at least 5 data points (cliff exclusion; empirically adjusted), and (III) the move value corresponding to a distortion ≠ 0 (significant change of state reported by Guppy). Based on the above, the fragments of the preprocessed signal with a fixed length of 100 data points centered on the signal anomaly were selected. If the signal deviation was near the tail terminus, the missing data points were randomly imputed based on the five most frequent values in the entire poly(A) signal. In this way, a set of vectors of equal length without missing values was produced. Each poly(A) signal was then converted into two single-channel (grayscale) GAFs: summation (GASF) and difference (GADF), which were then combined into an array (i.e., a tensor of shape 100 × 100 × 2). The list of these served as an input to the convolutional neural network.
Training dataset preparation
The classification model was trained using sequencing data corresponding to an in vitro-transcribed molecules equipped with a pure poly(A) tail or containing a single non-adenosine at fixed position. These synthetic RNAs were prepared as described in In vitro transcription and polyadenylation. To create training subsets containing cytidine, guanosine, and uridine, respectively, the fragments of poly(A) signals centered on the signal anomalies were selected as described in Signal transformation strategy. For further information see Supplementary Note 4.
The subset of signals consisting solely of adenosines, on the other hand, was prepared by selection of fragments which do not comply with previously adopted filtering criteria (i.e., devoid of significant signal distortions & corresponding state changes). All data processing steps are implemented in training set creation functions within Ninetails (outside the main analysis workflow). The resulting data were processed to obtain GAF arrays for each class separately, 9440 GAFs were sampled from each class, label-encoded, and shuffled. The resulting dataset containing 37,760 items in total was divided into the 80:10:10 ratio (training:test:validation).
Functions for filtering and transforming training sets are included in Ninetails (in addition to the basic workflow).
Model architecture
In the VGG-based model used for signal classification in our study, the input image was a tensor of shape 100 × 100 × 2 corresponding to the 100 data points (samples) derived from the original signal before the angular transformation. Our model consists of four blocks with an increasing number of filters (32, 32, 64, 128). The first two convolutional layers use a 5 × 5 kernel with the valid padding to sample wider local information, while subsequent layers use a smaller, 3 × 3 kernel with the same padding. Each block includes an iteration of 2D convolution, batch normalization layers with ReLU activation and He weight initialization, followed by 2D max–pooling and 50% dropout layers. Since the network has to perform a multi-class classification task, an output layer contains 4 nodes and uses the softmax activation function to assign the given image to one of the 4 classes (Supplementary Data 1). The model was fitted using a first-order stochastic gradient descent optimizer with a learning rate of 0.00154. The categorical cross-entropy loss function was optimized, and classification accuracy was monitored. The model was built and compiled in R using the keras55 package.
Model training and evaluation
Training included 36 runs in which the following hyperparameters were fine-tuned: batch size (100, 200), dropout (30%, 40%, 50%), activation function (linear, ReLU, GELU), and kernel initializer (He normal, Glorot normal). The network was trained for 20 epochs in each run, with early stopping (patience = 2) and model checkpoint callbacks. The R package tfruns56 was used to perform training and select the best model.
To assess the separability of the classes, the ROCs and AUCs were calculated using a one-versus-one approach with the R package pROC57, while the confusion matrix and statistics by class were calculated based on the validation data for the selected (best) model using the R package caret58.
Analysis of nucleotide composition of poly(A) tails
The raw classification results were corrected using a Ninetails’ built-in features to mitigate the potential segmentation error inherited from nanopolish software. Ninetails was launched with the option, which allows to filter out non-adenosines located in the tail extremities (qc = TRUE). The data was also filtered based on the normalized distribution of non-adenosines (reclassify_ninetails_data function). If, for a given transcript, the non-adenosine distribution mode was in the first quantile of the tail length, the data for these positions were marked as a potential artifact. Transcripts with 3’UTRs rich in pyrimidines (having semi-templated tails, like the Tmed9) were whitelisted. Ninetails’ built-in whitelists include, but are not limited to, human, worm and murine transcripts.
For individual samples/experimental conditions/genes, the frequency of reads containing non-adenosines and the frequency of separate non-adenosine occurrences reported by Ninetails were reported. The sum of reads containing a given non-adenosine was referred to as counts. The sum of separate occurrences of a given non-adenosine was referred to as hits. Frequencies of decorated reads (abundance ratios; AR) were calculated by dividing the sum of reads with non-adenosines (counts) by the total sum of reads representing a given gene/construct. In contrast, non-adenosine frequencies (length ratios; LR) were estimated by dividing the sum of the reported non-adenosine nucleotide positions for a given gene (hits) by the sum of the lengths of all poly(A) tails representing that gene/construct. The above calculations were performed for all non-adenosines combined and for each nucleotide separately (Supplementary Data 2–6). For biological samples, quantification was done at the gene level, unless otherwise stated.
Orthogonal validation of Ninetails with FLAManalysis
PacBio sequencing datasets were preprocessed with FLAMAnalysis pipeline (https://github.com/rajewsky-lab/FLAMAnalysis) according to the developers’ instructions2. Then, in the R environment, the data were reformatted to enable comparison with Ninetails outputs. Specifically, a set of custom functions was used to reverse complement the poly(A) tail sequences, generate a separate table of non-adenosine residues, count the frequencies of decorated reads (counts) and individual non-adenosines (hits). The resulting data were then merged with data produced by Ninetails. Based on the results of mapping to reference sequences, a subset of transcripts obtained with both platforms (ONT and PacBio) was selected, separately for HeLa cells and for C. elegans. This set was subjected to downstream analyses.
Non-adenosine profiling in Moderna mRNA-1273
Sequencing data from Moderna mRNA-1273 read samples (raw and from treated macrophages) were processed as described in detail by Krawczyk et al.16. Reads mapping to the Moderna mRNA-1237 sequence and unmapped reads with sufficient agreement with the reference nanopore signal were considered vaccine-derived reads. Tails longer than 100 nt and lacking terminal pentamer directly in the vicinity of the sequencing adapter were considered most likely re-adenylated.
Non-adenosine profiling in murine macrophages
The 100 most abundant transcripts were selected from transcripts represented by at least 300 reads in each sample (38 genes). The transcripts with the highest non-adenosine content were considered the top 100 transcripts with the highest combined non-adenosine length ratio among the transcripts represented with at least 300 reads in each sample (38 genes). The transcripts with the longest tails were selected as those with the longest average poly(A) tail lengths among those represented by at least 10 reads in each sample (35 genes). TENT5A/C substrates were indicated by statistically significant differences in adenylation between wild-type and Tent5aFlox/Flox/Tent5c−/− double knockout. P.values were estimated using the Mann–Whitney U test (two-tailed, alpha = 0.05) for samples untreated with the mRNA-1273, taking into consideration transcripts represented by at least 10 reads (40 genes). P.values were then adjusted for multiple comparisons using the Benjamini–Hochberg method. A NanoTail package59 was used to perform statistical inference. Protein-coding transcripts encoded in the mitochondrial genome were also scrutinized (13 genes).
Transcripts with significantly different non-adenosine content between wild-type and Tent5aFlox/Flox/Tent5c−/− mutant were indicated by Fischer’s exact test (alpha = 0.05). Only those represented by at least 10 reads in each group were taken into consideration. The false discovery rate was controlled using the Benjamini–Hochberg method. Calculations were done with the Ninetails software. The test was performed for samples untreated with the mRNA-1273. By combining all statistically significant transcripts, a final set of genes was determined. For these genes, changes in non-adenosine content over time after mRNA-1273 delivery were analyzed. Gene Ontology enrichment analysis was done with g:Profiler60.
Non-adenosine profiling in various murine cells
The 100 most abundant transcripts were selected from transcripts represented by at least 300 reads in given cell type (group). The transcripts with the highest non-adenosine content were considered the top 100 transcripts with the highest combined non-adenosine length ratio among the transcripts represented with at least 300 reads in given cell type (group). The transcripts with the longest tails were considered the top 100 transcripts with the longest average poly(A) tail lengths among those represented by at least 10 reads in given cell type (group). TENT5A/C substrates for BMDMs were determined based on the statistical inference described in previous paragraph, whereas for the remaining cell types were selected according to the literature data16,30,49.
Statistics and reproducibility
The sample size was not determined by a statistical method. Statistical analysis was performed using data from two or more biologically independent replicates. Statistical analysis of quantitative data was performed using the R environment. The statistical tests used in each case are described in the figure legends. Data were tested for normality using the Shapiro–Wilk test. Most experiments were repeated at least twice, yielding comparable results.
Data visualization
The results of the poly(A) nucleotide composition analyses were visualized with Ninetails’ built-in plotting functions, based on the ggplot261 and dplyr62 packages. Heatmaps were drawn with the ComplexHeatmap63 package. Genome browser-like view of Tmed9 gene was plotted with the Gviz64 package. The remaining plots were prepared using ggplot2.
Reporting summary
Further information on research design is available in the Nature Portfolio Reporting Summary linked to this article.