This section addresses the research questions. We start with assessing the quality of the speech act annotation. Then we describe the press conferences in terms of the speech acts, following the subquestions. And finally we evaluate how well a machine learned speech act classifier can help in reducing the annotation time and costs.
5.1 Identifying speech acts in the Dutch COVID-19 press conferences
Section 4.2.2 described that the inter-rater reliability as measured by Krippendorff’s \(\alpha \) was .71 for the single labelled sentences and .70 for all sentences. This is generally considered a viable score.
There are some points of attention, when annotating speech acts. The difficulty of implicit speech acts has already been covered above. Furthermore, the correct classification can depend on context and world knowledge not present in the sentence, and not even in the complete document. Consider for example, the sentence:
“Je moet je echt wel houden aan datgene wat ook in de bijsluiter staat, waar ook de EMA zijn uitspraak over heeft gedaan.” (You must stick to the package leaflet [of the Corona vaccine], as also pointed out by the EMA.)
From the surrounding sentences, we can infer that the sentence is about the package leaflet of the Corona vaccine. The sentence seems to indicate that the speaker insists the listener to do something, namely follow the prescriptions of the Corona vaccine. Without any context, one would classify this as a Directive. However, the speaker does not refer to anything the listener has any influence on. Namely, the speaker refers to the government’s policy on vaccination. The sentence indeed is a statement in which the speaker addresses the importance of sticking to the prescription of the vaccines, for which he himself is responsible. Viewed as such, the sentence could be taken as an, albeit very implicit (but after all, this is a politician speaking) Commissive.
5.2 Describing the press conferences in terms of speech acts
We now analyse the press conferences in terms of the annotated speech acts, covering five topics. First, we look at the overall distribution of the speech acts. Then we see how this distribution changes over time during the pandemic. Third, we relate the found distributions to the severity of the pandemic and to the main message of the PC. Fourth, we look whether certain speech acts have a preferred location within the press conferences. Finally, we look whether the different cabinet roles (Prime Minister and Minister of Health, Welfare and Sport) of the two speakers in the PCs is reflected in a different usage of speech acts.
Before diving into these five topics, it is important to note that because we are dealing with multi-labeled sentences, all distributions are normalized based on the number of annotations, not on the number of annotated sentences.
5.2.1 Overall speech act distribution
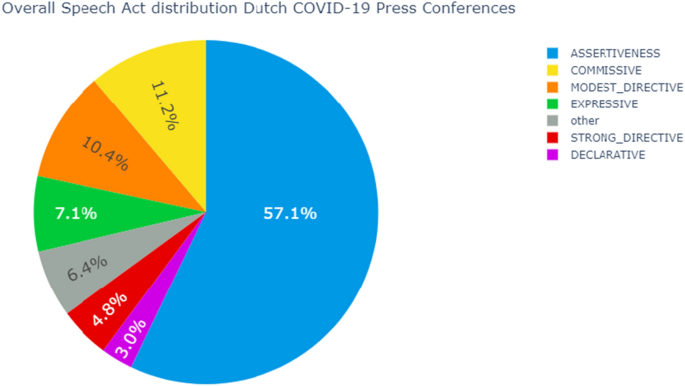
The overall speech act distribution is given in Fig. 3. As expected, the majority of annotations are Assertive. Taking the Modest and Strong Directives together, the Directives form the second largest speech act class and Modest Directives are used more than Strong Directives. The governmental representatives prefer requesting the people for their cooperation and pleading for compliance with regulations as opposed to ordering and commanding people to show certain behaviour. In a press conference on the 8th of May 2020, Prime Minister Mark Rutte expressed his view on his position: “Ik wil helemaal niet de baas spelen hier, dat ben ik ook helemaal niet.” Which translates to him saying he is not the boss, nor does he want to be.
The third largest speech act class is the Commissive, followed by the Expressive. Roughly six percent of the sentences were not assigned a speech act, as they did not belong to any of the speech act classes.
The smallest and therefore also notable speech act class in this distribution graph is the Declarative. In total, only three percent of all annotations were Declaratives. Declaratives refer to those utterances in which the speaker needs some contextual privileges to declare change by verbally stating it. In the context of the press conferences, these utterances have to do with easing, tightening and extending measures. As opposed to what one might expect, these utterances reflect only a small portion, namely three percent, of the annotations in the press conferences.
5.2.2 Change of speech act distribution over time
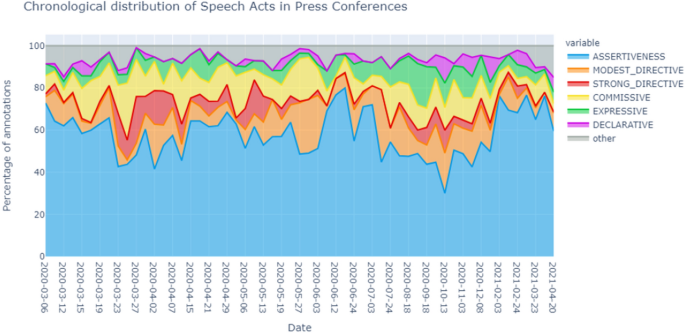
Figure 4 shows how the distribution of the speech acts per PC. This figure can be seen as a sequence of pie charts. The x-axis is chronological but not proportional with time, as PCs were much more frequent in the beginning of the pandemic. Figure 11 in the Appendix presents the same information as a stacked bar chart, allowing an easier comparison of specific PCs.
The figure shows that the distribution varies quite a lot over time. In general, Assertives remain dominant, peaking on the 19th of June 2020 and dropping on the 13th of October 2020. Modest Directives are often present. There is a peak in Modest Directives in the end of May 2020 and in the end of July 2020. Then, they are quite consistently present in the months August through December 2020, lessening its presence a bit from the end of January to April 2021. Strong Directives are less consistently present. They were mostly present from the end of March 2020 to June 2020, with its peak in the beginning of April 2020. They were least present in the summer of 2020, regaining its presence in the fall of 2020. Commissives and Expressives are quite consistently present but also peak in certain periods. Finally, again, we see the notably minimal presence of the Declaratives.
The next subsection provides plausible explanations for some of these changes.
5.2.3 Speech act distributions and real world phenomena
Now that we have seen that speech act distributions change over time, it is interesting to find out if real world phenomena are responsible for these fluctuations. In this section we will look at two related phenomena. First, we will consider whether a press conference eases or tightens regulations or is neutral in thi aspect. Second, we look at the number of daily hospital admissions of COVID-19 patients.
5.2.3.1 Type of press conference
The first related phenomenon we are going to look at is the characterization of the press conferences in terms of easing or tightening regulations. In Figure 5, press conferences in which additional measures were declared or existing measures were tightened are marked with a red dotted line, and those in which regulations were eased with a green dotted line. The remaining press conferences can be seen as neutral press conferences, as in these press conferences regulations were not eased or tightened.
Looking at all dotted lines in general, most of the Declaratives overlap with the dotted lines. This means that the Declaratives are over represented in press conferences in which regulations are eased or tightened, as expected.
We expect the same over representation for the Modest and Strong Directives, and the opposite one for the Assertives: the focus of neutral press conferences is to inform people on the current state of affairs. For the Expressives and Commissives, we expect no difference between the two types of PCs.
Table 1 contains for the two groups of press conferences, the proportions of sentences labelled with each speech act, and whether that difference is significant. We see that indeed the intuitive expectation backed up by Fig. 5, is statistically significant, and we find an over representation of the Expressives in the non neutral PCs as well.
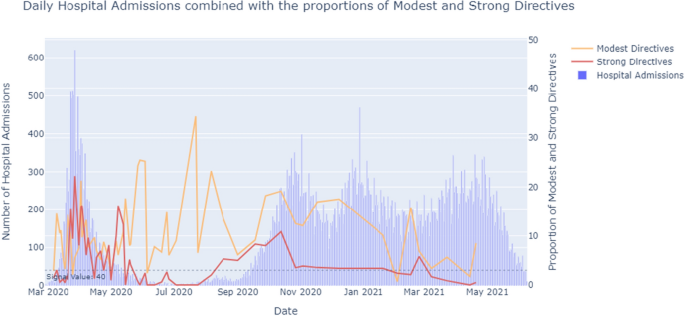
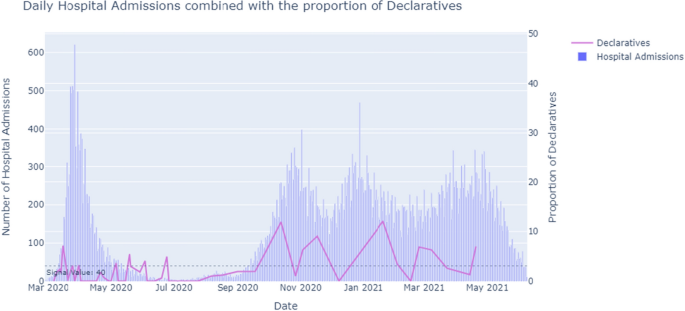
Speech Act distribution and the number of daily hospital admissionsIn the first peak of Corona hospital admissions (March-April 2020), the press conferences consisted of relatively more Modest and Strong Directives (Fig. 6). Additionally, this period showed tightening press conferences. The first Corona measures were announced, reflected by the Declaratives (Fig. 7). The Dutch were in the so-called Intelligent Lockdown.
During the months May, June and July 2020, the number of hospital admissions reached below the signal value of 40 a day. This period contained easing press conferences. However, the PCs in May still had a notable amount of Directives, with more Strong Directives at first, turning to more Modest Directives as time went on. A possible reasoning for the presence of these Modest Directives could be that the speakers felt the need to keep asking the people to stick to the existing basic main rules despite the easing of measures.
Mid-September 2020, the amount of hospital admissions had risen again, exceeding the signal value of 40 admissions a day. During this period, the proportion of Modest and Strong Directives started to increase as well. In the last weeks of August and the first weeks of September, the governmental representatives tried to steer the people using Expressives and Directives at first. Mid-September, they resorted to additional tightening measures, reflected by the increasing amount of Declaratives.
Mid-November 2020, the amount of hospital admissions started to drop, resulting in an easing press conference on the 17th of November. Shortly after, mid-December, the amount of hospital admissions rose again. On the 14th of December 2020, Prime Minister Mark Rutte held a special speech in ‘Het Torentje’. A strict lockdown was announced. Because this speech is not a press conference, it was not published on the press conferences webpage of the government. Therefore, this speech is not part of the annotated corpus.
During March and April 2021, the amount of hospital admissions rose again, after it had declined slightly during the months January and February. However, on the 14th and 20th of April 2021 measures were eased. These press conferences also show relatively little Modest and Strong Directives. This is against the trend described above. Apparently, other factors were at play in these press conferences.
5.2.4 Location of speech acts within a press conference
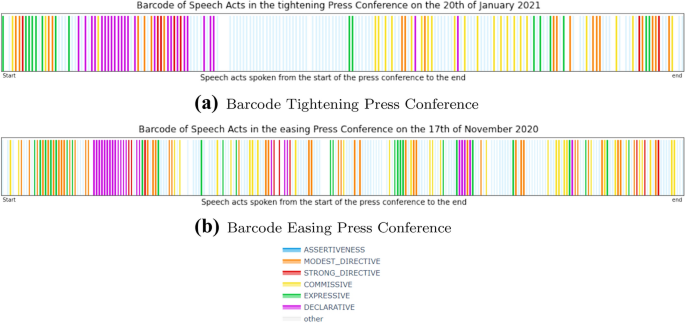
We now look whether there are patterns in the locations of the speech acts inside the press conferences. To appreciate such a ”close reading” approach, look at Fig. 8, which shows a PC as a sequence of colored bars, each bar representing a sentence, and the colors indicating the different speech acts. Let us first discuss these two prototypical PCs.
Colored barcodes of the tightening press conference on the 20th of January 2021 and the easing press conference on the 17th of November 2020. Each bar in this graph represents, in chronological order, a sentence spoken in the press conference. The color of the bar indicates the speech act of the sentence, following the same color scheme used previously
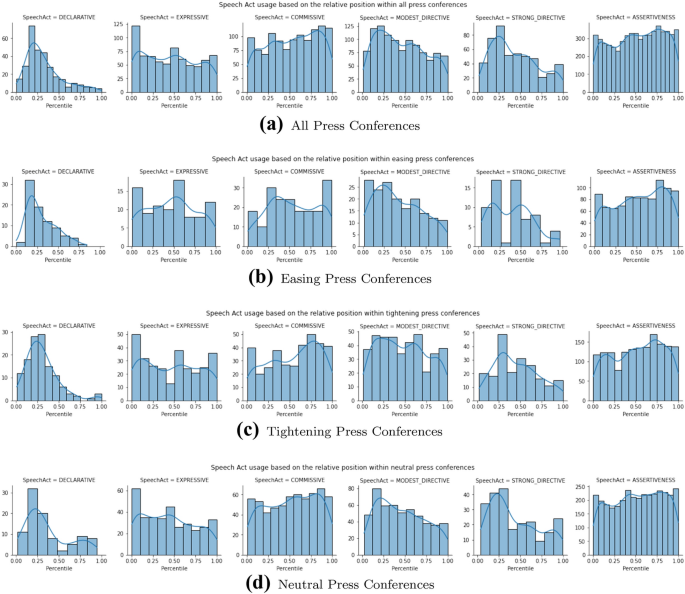
Now we take a broader view in Fig. 9, with subsets of PCs on the rows, and the 6 speech acts in the columns. Each little plot then depicts the absolute distribution of that speech act in that subset of PCs over the positions in the PC, measured in percentiles. Note that the y-axis scale varies both in the columns and the rows. But instead of the absolute numbers, we focus on the shape of the Kernel Density Estimation (KDE) line. The rows in the figure depict all, the easing, the tightening and the neutral PCs, respectively. What patters can we observe?
First of all, the Declaratives in column one. The population density plots show that the Declaratives are most often present in the first quarter of the press conferences, around the 20th percentile. This is evident in all types of press conferences (all four rows). Thus, Declaratives have a preferred location within a press conference and this location is not influenced by the type of press conference.
Second, the Expressives in column two. The Expressives are mostly present in the beginning of the press conferences, showing a little peak in the middle and in the end. The peak in the middle might relate to the fact that Minister De Jonge starts his introduction halfway. This pattern is evident in all four press conferences. Thus, Expressives are used more often in specific locations. The type of press conference does not influence these locations.
Third, the Commissives. In general, the Commissives are more often present at the end of the press conference. In easing press conferences, Commissives are mostly present in the beginning, around the 30th percentile and they spike at the end of the press conferences during the round of questions. In tightening press conferences, Commissives are mostly present at the end of the press conferences, around the 80th percentile. In neutral press conferences, Commissives do not have a clear location preference. Thus, Commissives have a preferred location, which is influenced by the press conference type.
Fourth, the Modest and Strong Directives. Both types of Directives are mostly present in the beginning of the press conferences. The same pattern holds for easing, tightening and neutral press conferences. Directives and Declaratives are mostly used in the same part of the press conference.
Finally, the Assertives. In general, the Assertives are quite evenly present, but tend to be used more often at the end of the press conferences. They are least present around the 25th percentile, which is also the percentile in which the Commissives and Declaratives tend to be most present. This pattern holds for all press conferences.
The general structure of a tightening press conference can be described as follows: First, some Expressives are used, followed by the Declaratives and the Modest and Strong Directives. These Declaratives and Directives are then explained by the use of Assertives, which are consistently present from this point on. Halfway, additional Expressives are used. In the second half of the press conference, Commissives are used, followed by some more Expressives near the end. The press conference on the 20th of January 2021 is a press conference that shows this general structure. Figure 8a shows a colored barcode of this press conference. Each bar in this graph represents a sentence in the press conference. The color of the bar indicates what speech act the sentence is classified as. The speech acts follow the same color scheme used previously, Assertives being light blue, Expressives being green, Commissives being yellow, Declaratives being purple, Modest Directives being orange, Strong Directives being red. Non-labeled sentences are white. This barcode depicts the general structure described above.
The general structure of an easing press conference is very similar to the general structure of a tightening press conference. The main difference lies in the location of the Commissives. In easing press conferences, the Commissives are more often present in the first half of the press conference. A second color barcode was constructed for the easing press conference on the 17th of November 2020, which is depicted in Fig. 8b. Again, we see the presence of the Expressives in the beginning of the press conference, followed by the Declaratives and the Modest and Strong Directives. Then, these are explained by the Assertives, which are consequently present from this point on. Again, Expressives are used in the middle and at the end.
The difference in Commissives between tightening and easing press conferences is evident when these two barcodes are compared. The easing barcode shows a concentration of Commissives in the second quartile and at the end of the press conference. The tightening barcode shows no Commissives in the second quartile. Instead, the Commissives are concentrated in the third quartile.
5.2.5 Difference in speech act usage between Rutte and De Jonge
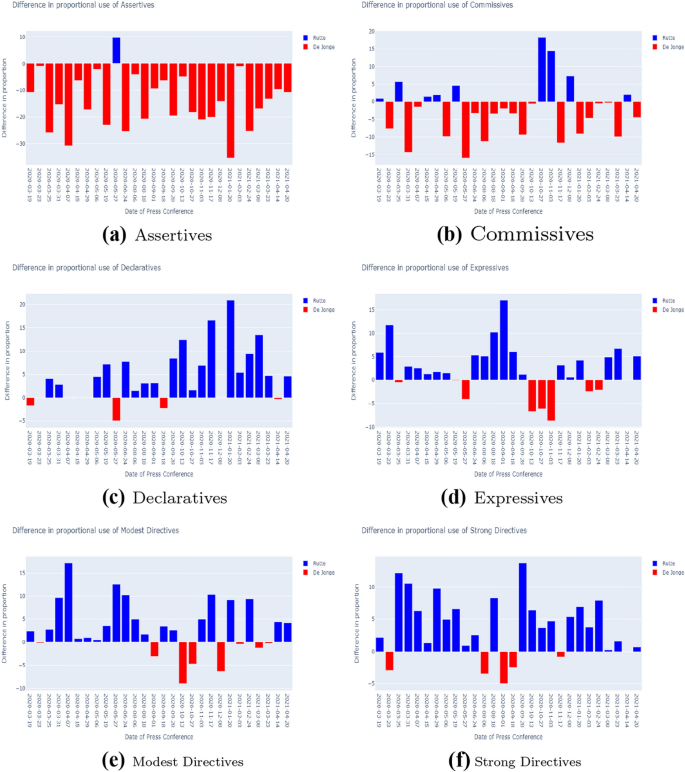
In this section, the difference in speech act usage between Prime Minister Mark Rutte and Minister of Health, Welfare and Sport Hugo De Jonge will be analysed. Rutte and De Jonge are the two main governmental representatives in the press conferences. In the press conferences, Rutte and De Jonge do not always speak the same amount of sentences. Therefore, for this comparison in speech act usage between the two speakers, the amount of speech acts annotations was normalized by the total amount of annotations for each speaker. Fig. 10 compares the speech act usage for the PCs in which both speakers were present. For each of these PCs, the speech act proportions of de Jonge were subtracted from those of Rutte. Thus a blue (positive) bar indicates overuse by Rutte, and a red (negative) bar overuse by De Jonge.
In Fig. 10a, it is evident that in most press conferences, De Jonge’s proportion of Assertives was higher than Rutte’s. Figure 10b shows that more often, De Jonge’s proportion of Commissives is higher. The graphs on the Expressives, Declaratives, Modest Directives and Strong Directives show that for these speech acts, Rutte’s proportion was more often higher than De Jonge’s.
What can be derived is that De Jonge is often responsible for informing the public on the current state of affairs using Assertives. Additionally, he is often responsible for addressing the government’s future steps in healthcare matters, like testing facilities and vaccination programs using Commissives. This is in line with his function as Minister of Health, Welfare and Sport. Furthermore, Rutte is mainly responsible for announcing regulations, which are reflected by the Declaratives. Additionally, he is responsible for steering the people’s behaviour in the desired direction by using Modest and Strong Directives in combination with Expressives. This is in line with his function as Prime Minister.
Comparison in speech act usage between Rutte and De Jonge. The amount of speech act annotations was normalized on the total amount of annotations for each speaker. The speech act usage was compared for the press conferences in which both speakers were present. For each of these press conferences, the speech act proportions were subtracted
5.3 Can machine learning speed up the annotation process?
We did not use machine learning (ML) in the annotation process, but now that we have a large volume of manually labeled sentences, we can address this question. In fact, it is relevant because at the time of writing several new Covid press conferences have occurred in the Netherlands, and we may want to update the created corpus.
The machine learning problem at hand is an instance of what is called multi-label, multi-class text classification: we can add a (possibly empty) set of 6 different speech acts to sentences. There are two ways in which we can apply ML: let the algorithm decide on the class (no more human in the loop), or let the algorithm give a ranked list of suggested labels, and let a human pick the correct ones. The first reduces most of the (annotation) costs but with a potential loss in annotation quality. The second will still have substantive annotation costs but with likely no loss in quality.
We will look at both scenariosFootnote 1, and see the influence of the amount of manually labelled training data on the scores. For the first scenario, we simply compute the accuracy of the classifier (how often was it correct); for the second we compute the reciprocal rank of the correct class (i.e., 1 divided by the rank of the correct class) and take the mean over all speech act classes (macro averaging) or over all sentences in the test set (micro averaging). For simplicity and ease of interpretion of the metrics, we did our experiments on the sentences labeled by zero or at most one speech act (N = 8628)Footnote 2.
We test two text classification approaches. First, a commonly used strong baseline, logistic regression on TF-IDF weighted word uni- and bigrams. Second, a state of the art text classification algorithm based on text embeddings, Roberta, trained on a Dutch corpus (Liu et al. (2019); Delobelle et al. (2020)). Our experimental setup is simple and realistic. We rank all our labelled sentences chronologically. We always use the last 20% as the test set, and vary the training set from the first 20% to the first 80%, in steps of 20%. We used grid search on the training set to find the optimal hyperparameters. All details of the settings of the experiment and more detailed results can be found in the SpeechActClassifier notebook in the dataset repository belonging to this paper.
We summarize our findings. When we look at accuracy, the two classification approaches perform almost identical having an almost maximal accuracy already with 40% of the training data. See Table 2. Both classifiers tend to make the same mistake: misclassify one of the five speech acts as an (majority class) Assertive.
The second scenario is evaluated with the mean reciprocal rank. The micro average takes the mean over all sentences, and is dominated by the majority class of Assertives. The macro average takes the average over the mean reciprocal ranks of the 7 classes and is a more meaningful measure given our intended use of the rankings. Table 3 contains the crucial results. We see that both classifiers have the same micro score of 0.83 with 80% of training data, but a quite different macro MRR score (.62 for LR versus .74 for Roberta). The semantically oriented text embeddings classifier is better at classifying the individual classes than LR working with only the lexical information. Table 4 in the Appendix contains a detailed overview of the scores for each speech act. Here we can see that all classes have (much) higher scores with Roberta than with LR, over each amount of training samples, at the cost of the majority class of Assertives. This explains the large increase in macro averaged reciprocal rank, with an equal micro averaged one.
With Roberta, all speech act classes have an MRR of at least .5, even with only 20% of training data. As the correct class on the first rank yields 1 point and at the second half a point, an MRR above .5 means that on average, the correct class is found in the first two ranks. We can conclude that if high quality labels are desired, a dual annotation system in which an Roberta based algorithm ranks the speech act classes for each sentence and a human corrects the judgement works well and saves annotation time, even with relatively little (N=1725 sentences) training data.
